NOTE: This post is part 1 of 2. Part 2 will be released within the next week of this post.
This post will hopefully demonstrate that pmacct along with exabgp are both fantastic tools and also demonstrate how I would personally plan to build a large scale netflow collection infrastructure. What if you could build your own free, open source, auto DDoS mitigation platform based on policies you configure? There are already both paid and open source implementations of this, so if you are interested in just seeing another idea related to this then stick around!
Let’s talk about what we aim to achieve when building this solution:
- Collect Netflow data
- Convert the Netflow data into readable format so we can process the data
- Store the data so we can perform historical graphing/query it for future use
- Allow the user to configure policies that match specific thresholds and alert via some form of communication, whether it be an email or an alert into Microsoft Teams/Slack
- Announce BGP flowspec rule after the policy threshold has exceeded the defined limit to the network
- Withdraw the BGP flowspec rule after re-evaluating the policy and when the threshold is no longer met
Initial Diagram
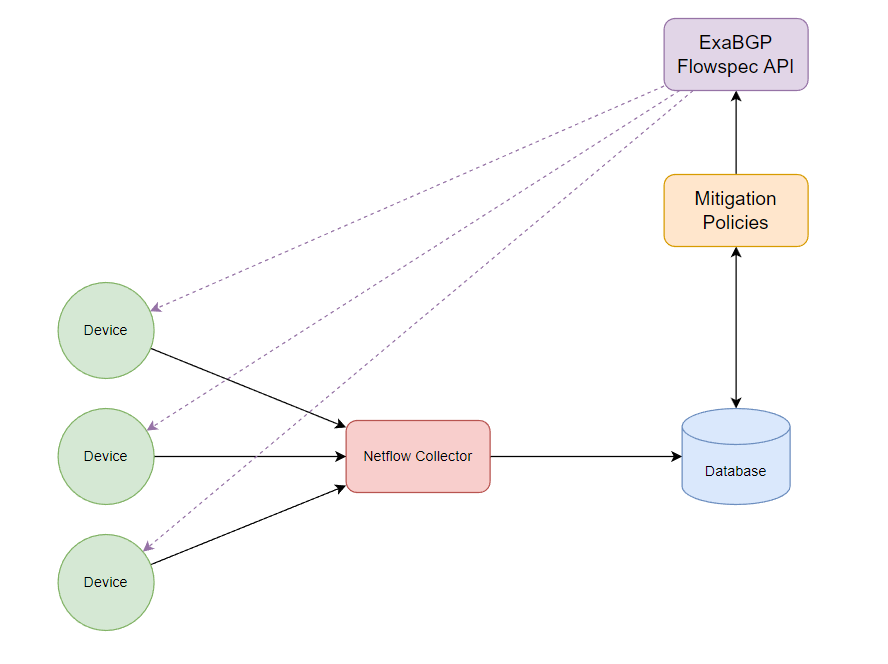
The basic concept is that our devices will send Netflow data to the collector, the collector will store the flow data inside a database and we will have a separate script that will perform SELECT queries against our database and attempt to trigger a BGP Flowspec rule to mitigate the traffic if it exceeds the policy threshold. We won’t do anything fancy during this blog and create a beautiful frontend but this is something to consider if you want to build a product or solution, giving the user options to build these policies based on certain attributes such as, TCP/UDP/ICMP traffic or something like specific bits per second thresholds.
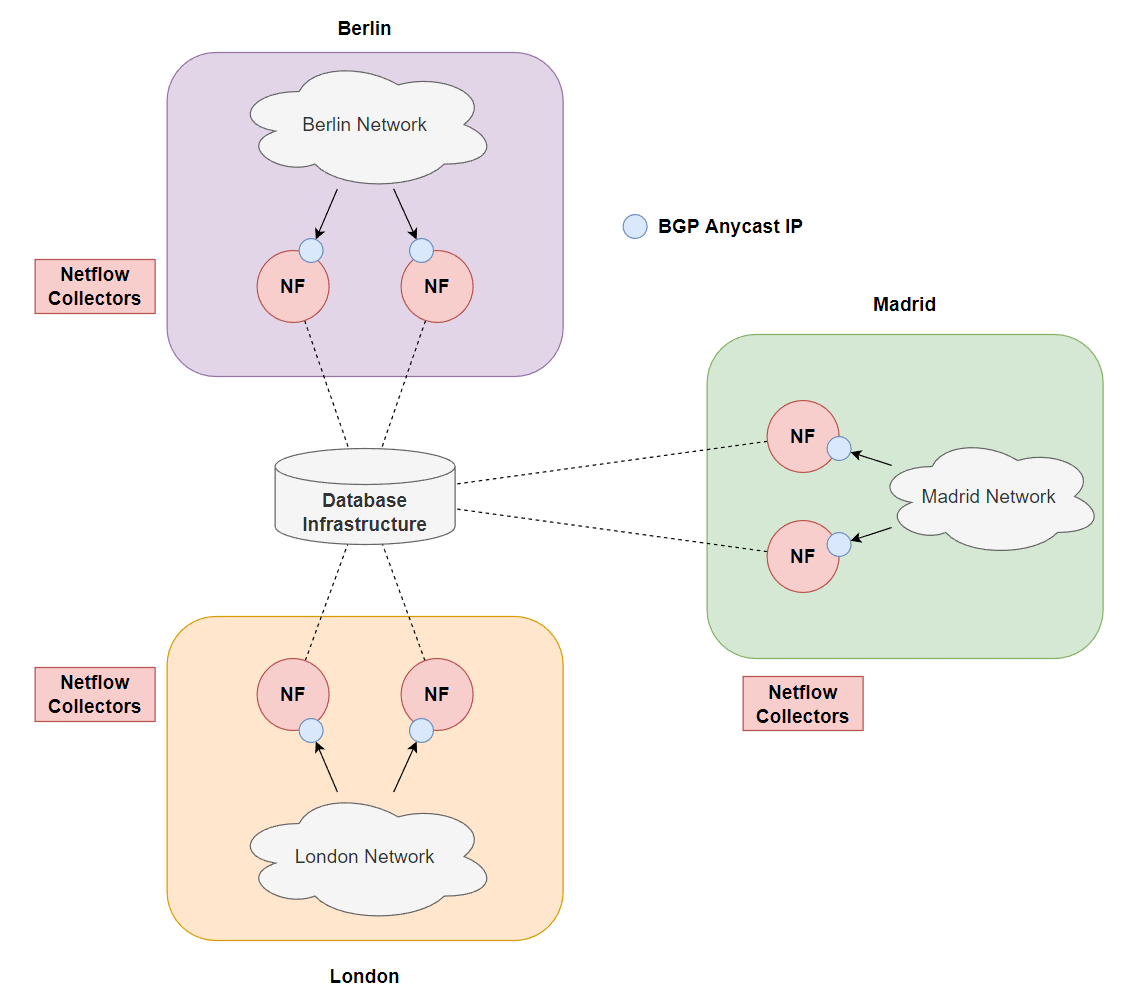
How do we collect the Netflow data but ensure our single netflow collector doesn’t run out of resources when trying to capture the data and insert it into a database? If you need to spread the workload within your network you could use something like BGP anycast to ensure exported netflow data goes to the closest datacenter which not only keeps traffic local in your large network but also ensures that you are not overloading a single collector with the bonus of redundancy if 1 netflow collector breaks, something like this:
Let’s focus specifically on a single area and try to keep in mind horizontal scalability. Although you may implement something like BGP anycast to ensure devices prefer their local city netflow collectors, we still need to be able to scale this out so that we can add more collectors if we start hitting limits with flows per second, obviously the database infrastructure will need to scale alongside with this but for now, we will just add a UDP load balancer behind the BGP anycast IP to round robin each UDP packet (which will essentially be 1 or more flows). Take this below example of one of the UDP packets that would be load balanced:
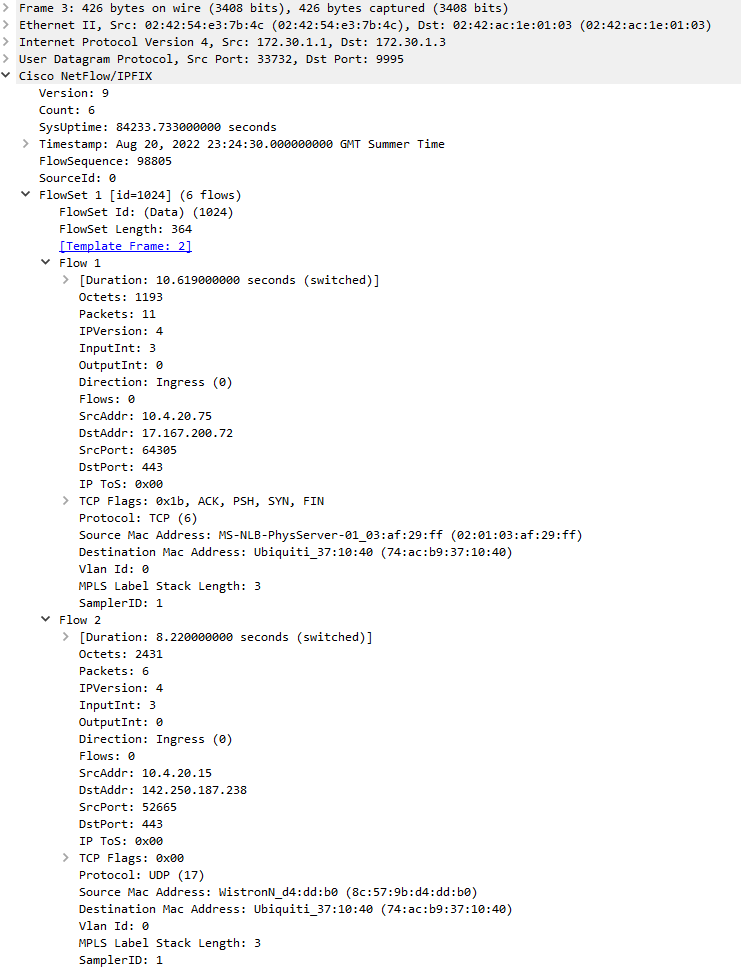
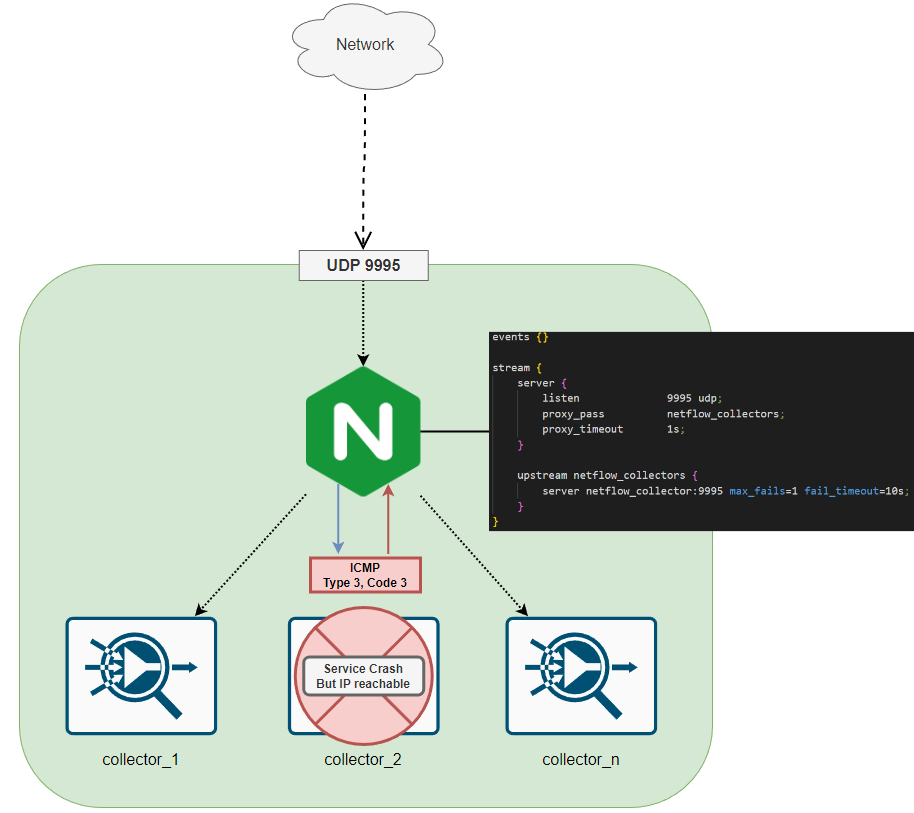
As you can see in the Wireshark capture, this is Netflow v9 data with a FlowSet containing 6 separate flows. All the unique information which can be used to identify the source/destination/start and end times/ports/other flags you may want to use for the mitigation is contained within the UDP payload so this is perfectly safe to load balance across multiple collectors and I can’t see any issues with doing this until we start talking about flows with a long life. As per the above diagram, imagine on a more low level that this is the setup of each local city/country network:
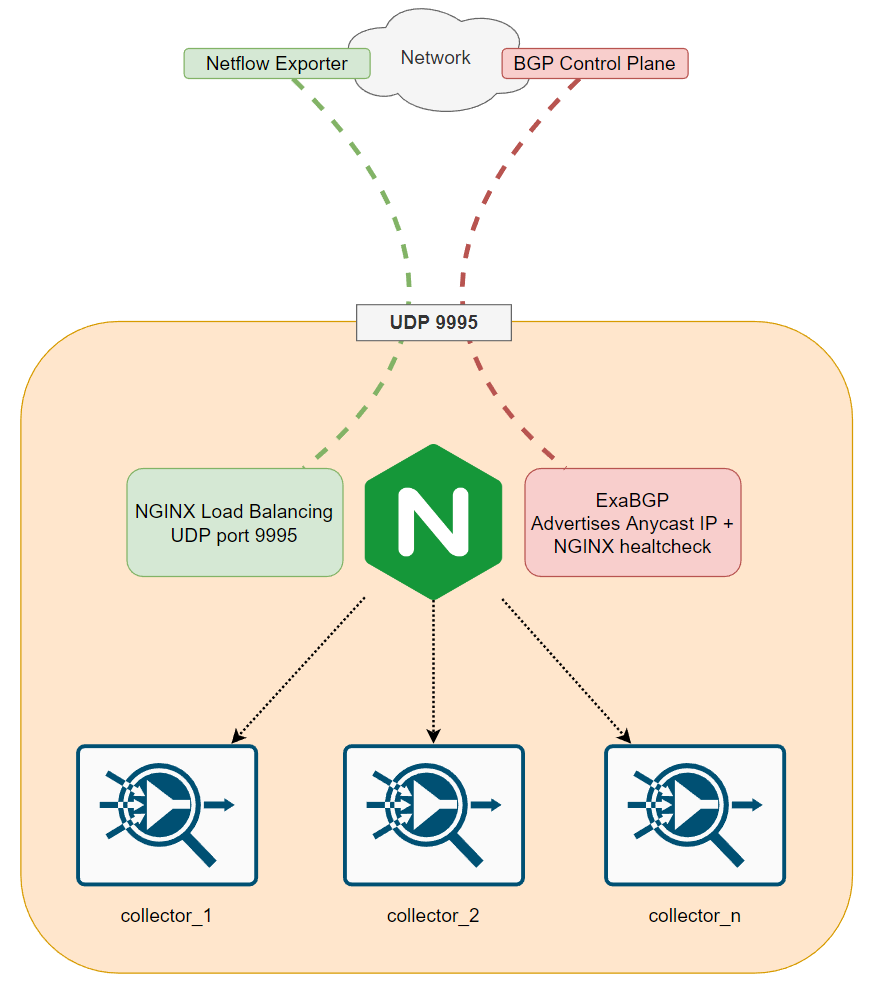
I choose NGINX here because I know it will take me minutes to figure out how to utilize the in-built UDP load balancer feature to get the demo rolling. ExaBGP I also choose for the same reason however how can we perform a health check? We are not attempting to get data but just send it from the Network to the netflow collectors so how can we ensure the collectors and NGINX service is in a healthy state? Firstly, we would need to implement some logic to separately test each collector because we might not want to completely cut off all collectors and ensure traffic goes to another city where the collectors are healthy, while I won’t cover that in this blog since we will take the easier approach and stop advertising the BGP anycast address if any of the collectors fail to receive a netflow record. You would probably want to monitor each collector and only rebuild the collectors if there is a service issue or remove them from the group of collectors the load balancer will be sending the UDP traffic to, for example my take on this would be to expose separate ports for each collector so you can create a healthcheck script that creates and writes a netflow record to each server in your group, when the netflow process writes to the database, metadata can be added onto the flow record to determine which collector it was received from which can be used in your health check script to ensure you see a relevant record from each collector. You could also write some more metadata within the flow to uniquely identify the record within the database, like a generated UUID that is specific to only that check.
However we will simply be utilizing the UDP passive healthcheck which allows NGINX to simply stop forwarding data to the collector if it replies with an ICMP error or times out (UDP doesn’t time out… this is referring to the NGINX service suddenly not being able to forward the UDP traffic to a container due to an underlying host resolution issue or routing issue within docker), this check isn’t the most reliable but we are simply checking if sending some UDP data to the relevant port responds with a ICMP port unreachable, if this happens then NGINX will stop forwarding traffic to the relevant host and mark it as unhealthy for some time. NGINX Plus does expose an API which allows you to remove servers from a group which would probably suit the Netflow record + checking database script as mentioned before. This check assumes that the container/server is reachable on the IP layer but for some reason the service is not running on the relevant UDP port so therefore an ICMP port unreachable is sent back to NGINX. Timeout configuration in the diagram is not related to the client (obviously because UDP is connectionless) but to do with the load balancer not being able to send data to the server for some reason (eg. the domain name is unreachable therefore this is considered a “proxy_timeout”)
Each collector will be running a tool/daemon from the pmacct suite of tools called nfacctd (Netflow accounting daemon), there are official docker images which can be used, in our case we will run the netflow collectors in containers and pass configurations of the relevant plugins such as the MySQL server + credentials and which fields we want to collect and store in the database. Let’s hit the first 3 objectives we set head on, deploying all services in containers, collecting the data and storing it in a MySQL database. Although we will only be deploying this on a single machine for the demo, the purpose of a semi-complicated setup is to show that you can scale the collectors based on a simple UDP load balancer so that multiple collectors can now begin to process the netflow data and input them into a central database.
Setting up the Netflow infrastructure
nfacctd - Capturing Netflow data
As previously mentioned, pmacct provide an official docker image which will use for the container.
version: "3.6"
services:
  netflow_collector:
    image: pmacct/nfacctd:latest
    restart: always
    ports:
      - "9995:9995/udp"
    volumes:
      - ./netflow_collector/nfacctd.conf:/etc/pmacct/nfacctd.conf:ro
The docker image compiles all supported plugins so we can enable the mysql plugin straight away. here is the nfacctd.conf file.
daemonize: false
nfacctd_port: 9995
nfacctd_time_new: true

plugins: mysql

aggregate: src_host, dst_host, src_port, dst_port, tcpflags, proto

sql_optimize_clauses: true
sql_history: 10m
sql_table_version: 9

sql_host: db
sql_port: 3306
sql_user: pmacct
sql_passwd: arealsmartpwd
Our database will also be hosted in a container called “db” as per the sql_host variable. Ensure that if you are not using the default database schema and customizing your own, then you want to ensure the relevant aggregate fields are only selected from the netflow data which can be achieved by using sql_optimize_clauses: true. If you don’t set this then nfacctd will still attempt to insert data within the flow data into the database but will error because the column will not be created in your database tables. The default table is also called acct so if you have changed this in the next section, ensure you set the sql_table: <table name> variable.
Database
The database we will be using is MySQL. A very important part before we run the collector is that we need to ensure the following:
- Netflow Schema is deployed
- Ensure our
pmacctuser has the right privileges to write to this database
Because we have selected the relevant fields we want to store (aggregate variable in the nfacctd.conf file), we don’t need to create the full schema to include the useless data, for example I am not capturing VLAN information, the required fields in any custom schema are:
CREATE TABLE acct (
	packets INT UNSIGNED NOT NULL,
	bytes BIGINT UNSIGNED NOT NULL,
	stamp_inserted DATETIME NOT NULL,
	stamp_updated DATETIME
);
Let’s add our relevant fields that we are capturing. Note that most of these fields come with a default NOT NULL, pmacct provides great documentation on recommended database types, also note that in this documentation that src_host actually maps to ip_src, ensure that you follow the documentation if you are not importing the version 9 schema and customizing your own because some fields are slightly different between the versions and if named wrong then the mapping that nfacctd performs might cause errors. Let’s create our initial sql script that will be ran upon our mysql container running, drop the table if it exist and create our user + permissions.
DROP DATABASE IF EXISTS pmacct;
CREATE DATABASE pmacct;

USE pmacct;

DROP TABLE IF EXISTS acct;
CREATE TABLE acct (
    ip_src CHAR(45) NOT NULL,
    ip_dst CHAR(45) NOT NULL,
    port_src INT(2) UNSIGNED NOT NULL,
    port_dst INT(2) UNSIGNED NOT NULL,
    tcp_flags INT(4) UNSIGNED NOT NULL,
    ip_proto CHAR(6) NOT NULL,
	packets INT UNSIGNED NOT NULL,
	bytes BIGINT UNSIGNED NOT NULL,
	stamp_inserted DATETIME NOT NULL,
	stamp_updated DATETIME,
    PRIMARY KEY (ip_src, ip_dst, port_src, port_dst, ip_proto, stamp_inserted)
);

CREATE USER 'pmacct'@'%' IDENTIFIED WITH mysql_native_password BY 'arealsmartpwd';
GRANT ALL PRIVILEGES ON pmacct.* TO pmacct@'%';
I’m going to store this script as 01-create-database.sql within a folder called init and mount this folder to the /docker-entrypoint-initdb.d directory on the mysql container. This script will act as an entrypoint and be executed upon starting our database container, resulting in our database, tables and user being created. The docker-compose configuration for this service is below, append it to the existing services of any yaml shown above in this post. I also pass some environment variables using a file
  db:
    image: mysql
    ports:
      - "3306:3306"
    restart: always
    env_file:
      - ./envs/mysql.env
    volumes:
      - ./database/init:/docker-entrypoint-initdb.d
Let’s run these services before we dive into the NGINX UDP load balancing to prove that everything is working as expected. I am currently exporting the netflow records from my Ubiquiti USG. The configuration for that can be found below:
system {
    flow-accounting {
        interface eth1
        netflow {
            sampling-rate 1
            server 10.4.20.98 {
                port 9995
            }
            timeout {
                max-active-life 1
            }
            version 9
        }
    }
}
After running docker-compose up --build, you’ll see nfacctd starts up and reads the relevant configuration file:
netflow_collector_1  | INFO ( default/core ): NetFlow Accounting Daemon, nfacctd 1.7.7-git (20211107-0 (ef37a415))
netflow_collector_1  | INFO ( default/core ):  '--enable-mysql' '--enable-pgsql' '--enable-sqlite3' '--enable-kafka' '--enable-geoipv2' '--enable-jansson' '--enable-rabbitmq' '--enable-nflog' '--enable-ndpi' '--enable-zmq' '--enable-avro' '--enable-serdes' '--enable-redis' '--enable-gnutls' 'AVRO_CFLAGS=-I/usr/local/avro/include' 'AVRO_LIBS=-L/usr/local/avro/lib -lavro' '--enable-l2' '--enable-traffic-bins' '--enable-bgp-bins' '--enable-bmp-bins' '--enable-st-bins'
netflow_collector_1  | INFO ( default/core ): Reading configuration file '/etc/pmacct/nfacctd.conf'.
netflow_collector_1  | INFO ( default/core ): waiting for NetFlow/IPFIX data on :::9995
netflow_collector_1  | INFO ( default_mysql/mysql ): cache entries=32771 base cache memory=13942904 bytes
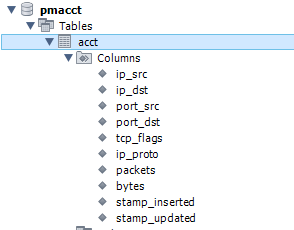
The MySQL schema and tables have all been created as expected:
After waiting for my USG to push netflow packets to the collector, we see nfacctd purging its cache. All plugins have a memory cache which will be wrote to the database upon the next purge event. In our case with mysql, our sql_refresh_time: 30 forces this event to happen every 30 seconds, however if the database is unreachable, nfacctd will cache the entries and by default for the mysql plugin this is 32771 entries. It’s extremely important to consider in the event of the database being unreachable that the next time it is available to ensure that nfacctd is able to write all the entries stored in the cache before the next purge event occurs. Otherwise you may start running out of memory or unable to store any more data in the cache resulting in a loss of flows and therefore your network insights are no longer accurate.
netflow_collector_1  | INFO ( default_mysql/mysql ): *** Purging cache - START (PID: 9) ***
netflow_collector_1  | INFO ( default_mysql/mysql ): *** Purging cache - END (PID: 9, QN: 13/13, ET: 0) ***
netflow_collector_1  | INFO ( default_mysql/mysql ): *** Purging cache - START (PID: 10) ***
netflow_collector_1  | INFO ( default_mysql/mysql ): *** Purging cache - END (PID: 10, QN: 168/168, ET: 0) ***
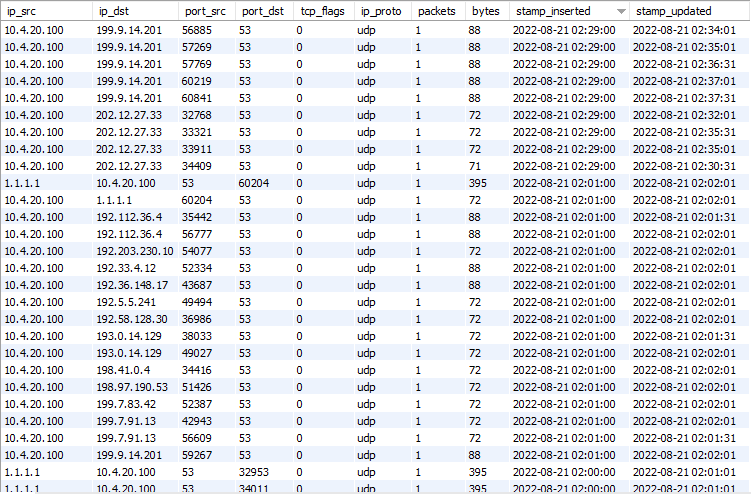
QN stands for Query Number, this essentially proves that our data has been inserted into the database. Note that you could send the flows cached by nfacctd to other services with the supported plugins like rabbitmq, kafka or redis within the same nfacctd.conf configuration file.
NGINX Load Balancing
If you are using something like Docker Swarm, you can utilize the layer 4 load balancer built into swarm however I am utilizing nginx as an example to scale out the collectors that might run on other systems that may not utilize docker swarm, and also the fact that I can perform the basic UDP passive checks as a demo. Let’s start out with the base configuration, if you are manually scaling your collectors then you can define each collector under the upstream configuration, however in our case because we will test with the scale command in docker-compose, we will only have 1 host which nginx will forward UDP packets towards port 9995 and then docker will internally load balance between the 3 containers, its slightly cheating on this demo but the same concept still applies and I just want to demonstrate that you will be able to scale with a UDP load balancer infront of all of your netflow collectors.
events {}

stream {
    server {
        listen              9995 udp;
        proxy_pass          netflow_collectors;
        proxy_timeout       1s;
    }

    upstream netflow_collectors {
        server netflow_collector:9995 max_fails=1 fail_timeout=10s;
    }
}
docker-compose service added into docker-compose.yml, along with all the above defined services up to this point in the blog. Note that for the nginx container to be able to resolve our netflow_collector container name is to ensure depends_on is present under our nginx config.
nginx:
    build: ./nginx
    volumes:
      - ./nginx:/etc/nginx/conf.d
    ports:
      - "9995:9995/udp"
    depends_on:
      - netflow_collector
Due to running into a few issues with the stream {} configuration not being allowed, I had to create a Dockerfile that simply pulls nginx and copies the nginx.conf. For some reason, if you attempt to mount a volume or use templates then it still complains…
Dockerfile
FROM nginx
COPY nginx.conf /etc/nginx/nginx.conf
After running docker-compose up --build --force-recreate --scale netflow_collector=3, we see our netflow_collector container scaled:
netflow_collector_1  | INFO ( default/core ): NetFlow Accounting Daemon, nfacctd 1.7.7-git (20211107-0 (ef37a415))
netflow_collector_2  | INFO ( default/core ): NetFlow Accounting Daemon, nfacctd 1.7.7-git (20211107-0 (ef37a415))
netflow_collector_3  | INFO ( default/core ): NetFlow Accounting Daemon, nfacctd 1.7.7-git (20211107-0 (ef37a415))

netflow_collector_1  | INFO ( default/core ): Reading configuration file '/etc/pmacct/nfacctd.conf'.
netflow_collector_2  | INFO ( default/core ): Reading configuration file '/etc/pmacct/nfacctd.conf'.
netflow_collector_3  | INFO ( default/core ): Reading configuration file '/etc/pmacct/nfacctd.conf'.

netflow_collector_1  | INFO ( default/core ): waiting for NetFlow/IPFIX data on :::9995
netflow_collector_2  | INFO ( default/core ): waiting for NetFlow/IPFIX data on :::9995
netflow_collector_3  | INFO ( default/core ): waiting for NetFlow/IPFIX data on :::9995

netflow_collector_1  | INFO ( default_mysql/mysql ): cache entries=32771 base cache memory=13942904 bytes
netflow_collector_2  | INFO ( default_mysql/mysql ): cache entries=32771 base cache memory=13942904 bytes
netflow_collector_3  | INFO ( default_mysql/mysql ): cache entries=32771 base cache memory=13942904 bytes
and finally, after waiting for a few seconds for my USG to send netflow data again, we can see upon the collectors triggering the next purge event that 67 flows were processed by collector_1, 33 flows on collector_2 and 63 flows on collector_3. I would agree if you said this isn’t a lot of flows however, the concept works and we can proceed with wrapping up the first part of this blog post.
netflow_collector_1  | INFO ( default_mysql/mysql ): *** Purging cache - START (PID: 9) ***
netflow_collector_2  | INFO ( default_mysql/mysql ): *** Purging cache - START (PID: 9) ***
netflow_collector_3  | INFO ( default_mysql/mysql ): *** Purging cache - START (PID: 8) ***

netflow_collector_1  | INFO ( default_mysql/mysql ): *** Purging cache - END (PID: 9, QN: 67/67, ET: 0) ***
netflow_collector_3  | INFO ( default_mysql/mysql ): *** Purging cache - END (PID: 8, QN: 63/63, ET: 0) ***
netflow_collector_2  | INFO ( default_mysql/mysql ): *** Purging cache - END (PID: 9, QN: 33/33, ET: 0) ***
We can also add some data to the flows stored in the database regarding which collector they were inserted by, however we would need to ensure the new field is created in the schema. For example to capture the data regarding the IP address of the exporter, you can use peer_src_ip under the aggregate list. If you are using RabbitMQ or Kafka instead then you can use the writer_id_string and hardcode a string to send to the broker.
I think all of these screenshots, output and reading is telling us that we need to create a separate part talking about the ExaBGP implementation and being able to setup a better lab to support the BGP part of the solution, and then proceed with the policy configuration to allow a user to define a configuration that blocks something like high ICMP packets to a specific destination or a sudden increase of x amount of mbps with TCP/UDP protocols. I hope that I have kept you interested so far and wanting to check out part 2 of this post which will be released within the next week or so after this post goes live (I hope…). We have currently solved the first 3 objectives of the blog, in the next part we will focus on:
- Allow the user to configure policies that match specific thresholds and alert via some form of communication, whether it be an email or an alert into Microsoft Teams/Slack
- Announce BGP flowspec rule after the policy threshold has exceeded the defined limit to the network
- Withdraw the BGP flowspec rule after re-evaluating the policy and when the threshold is no longer met
Please feel free to ask any questions and if you would like to see the configuration used in this blog, you can view all this here. You can also find some sneak peaks at the previous way I attempted to build this solution by using nfcapd/nfdump and Python + RabbitMQ.