Netbox is cool and all… It’s a neat little IPAM (with other features integrated) and is extremely easy to spin up a pre-built docker container for experiemental purposes. Many months ago, I was tasked to set up a tool called Grafana. I’ve never heard of this tool before and at first impressions, I thought it was a pretty visualization tool for network bandwidth and anything else you can pull from SNMP. Oh boy was I wrong…
If you were to compare Grafana to a sandwhich (Subway), I would say it’s the nice crispy toasted herb and cheese bread that houses the delicious core of Genoa salami, spicy pepperoni and ham, spicy jack cheese with fresh iceberg lettuce, insert salad here topped with sweet chilli sauce. Now take out the meat, cheese, salad and sauce and now what do you have? A very empty stomach…
In layman terms, Grafana requires data input and doesn’t handle SNMP collecting, Telemetry streams, databases etc… You need a data source which will store the data collected via SNMP or Telemetry in our case which also requires some kind of collector which will then take the SNMP data or Telemetry data and then convert it into a format which can be stored into our database and presented to Grafana when it queries the database to create the beautiful looking graphs. This is a just a small blog post to go along with a Github repository so I could go on and start describing how Telemetry works, how APIs work, how to configure SNMPv3 but I’m just going to show you an overview of the demo scenario and how you can easily put something together in python to make life much easier if you’re looking to do something as the title of this blog describes.
We’ve talked about the bread of this project, the final 2 other tools/open-source applications are the core of the sandwhich…
-
InfluxDB (or insert DB eg. Promethus here) which is a “time-series” database, optimized to handle specific data aka. time series data… Capturing interface octets in and out at 10pm on a tuesday night is useful, but what use is it if we can’t store the results of the interface octets in and out every x minutes each day and have a reference to a time series (eg. timestamp) which allows us to draw out our bandwidth graph..
-
Telegraf collects metrics and because there are so many “plugins” developed for Telegraf, we can simply use the SNMP Input plugin as an SNMP Collector and use the InfluxDB Output plugin which will make Telegraf interact with our database and store our SNMP data so that we literally have to do 0% big brain work and start collecting some SNMP metrics. Telegraf has around 200+ plugins which can be found with a quick google search.
To run Netbox, I’m using the docker container that can be found here: https://github.com/netbox-community/netbox-docker. I’m not going to run through the Netbox part of things because there are many blogs and great documentation around to be able to create a device on Netbox. The only thing I will show is how to create the Netbox API token and webhook. Let’s take a look at that and a simple demonstration how to interact with Netbox using the pynetbox python module.
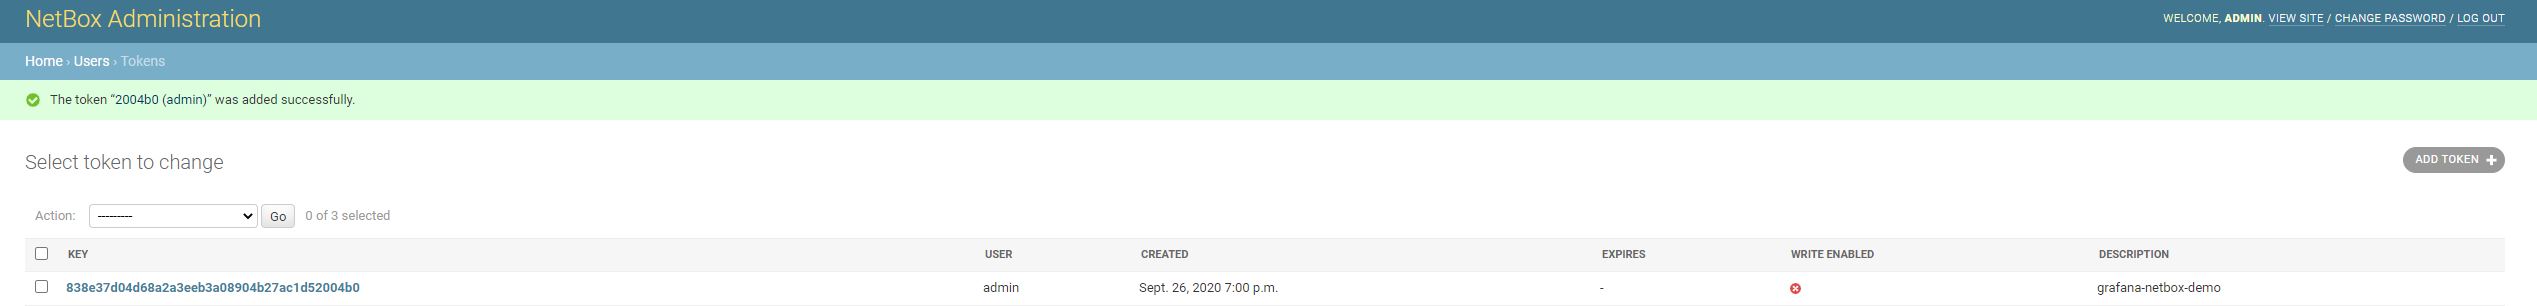 Here I’ve navigated to the Admin options within Netbox, and created a new token… If you want to try to hack my Netbox container, you can reach it at 127.0.0.1:32768… Just don’t try to DDoS it!
I’ve gone ahead and created a python environment, activated it and then finally installed the pynetbox module:
python3 -m venv .venv
source .venv/bin/activate
pip install pynetbox
This next part, you can find the full demonstration in the github “demo_scripts” folder called “netbox_interaction.py”.
Interacting with Netbox via Python
If we import the pynetbox module that we installed, we can then establish a connection to netbox and let the module handle the HTTP GET/POST messages and we will have a python object to interact with.
import pynetbox # Import the python module so we can use it

nb = pynetbox.api(
    'http://192.168.0.16:32768', # Your Netbox Host URL
    token='838e37d04d68a2a3eeb3a08904b27ac1d52004b0' # Your Netbox API Token generated in the Admin view
)

devices = nb.dcim.devices.all() # Returns a list of all the devices in our Netbox instance
for device in devices: # Loops through each interaction of the list
    print(device.name) # Prints the name assigned to the device in Netbox. Our device class is handled by the pynetbox module and creates a python object to make it programmatically easier to interact with...
Running the script…
(.venv) bspendlove@home-ubuntu:~/dev/github/grafana-netbox-demo/demo_scripts$ python netbox_interaction.py
CSW02
acc1.test.lon
The documentation for pynetbox isn’t the best however you can get started with the basics to filter devices by specific inputs such as Sites/Vendors/Device Types etc… with google.
Creating a basic webhook
Navigating to the Admin settings again, click Webhooks and you are presented with a blank screen (if you have no current webhooks)… Firstly, what are webhooks?
Webhooks can provide a way to provide an external application with some information related to a trigger or a change… When we create a device or update a device, we can get Netbox to send a HTTP POST with useful data to our own web server and then perform actions based on the data within that request we receive. This is extremely useful in our scenario if we would like to automate interface graphs instead of having to manually update a new/existing interface within the Grafana dashboard when a new device is added or an existing device has changed in Netbox.
Let’s create a webhook that will be sent to a server on port 3001 when either: 1) A device has been created (which includes adding or removing an interface) 2) An existing device has been modified
Then we will build a very very simple Flask application that listens on that port to print the POST request data so we can take a look what is sent when the above 2 conditions have been met/triggered.
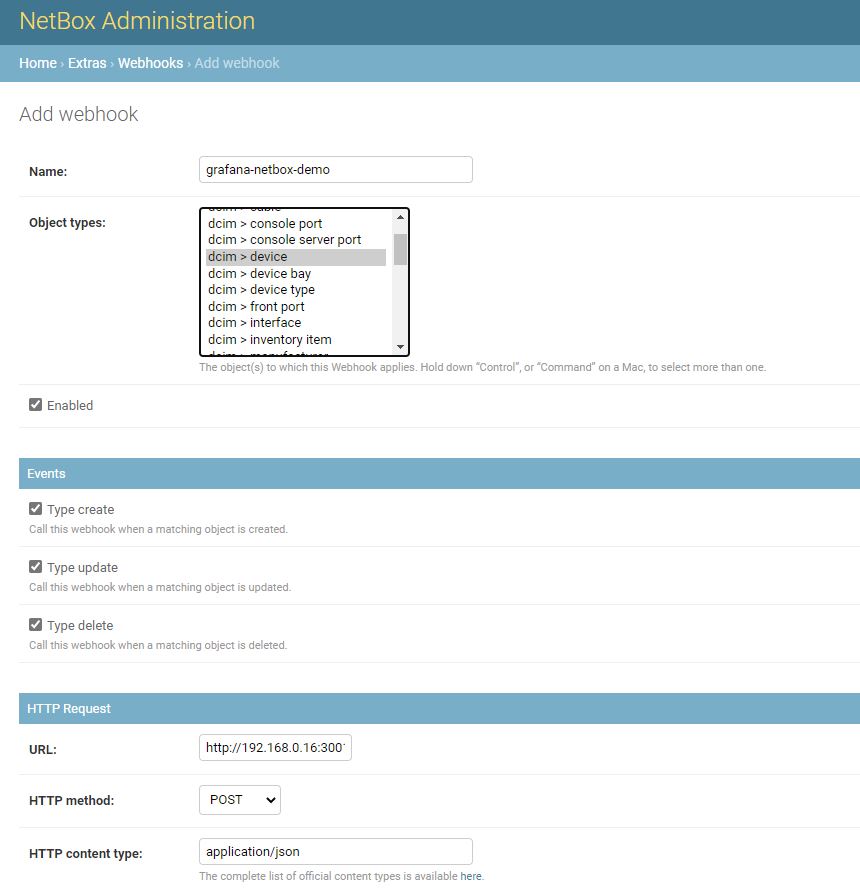
Just a quick explanation, the webhook is enabled for dcim > device for events: Create/Update/Delete. This is a HTTP POST request that will be send to http://192.168.0.16:3001 with application/json content-type. This is useful because we can simply request the JSON data with 1 function in Flask… I’ve saved this and let’s quickly build the base demo Flask server.
(.venv) bspendlove@home-ubuntu:~/dev/github/grafana-netbox-demo/demo_scripts$ pip install flask
(.venv) bspendlove@home-ubuntu:~/dev/github/grafana-netbox-demo/demo_scripts$ vi base_demo_flask.py
from flask import Flask, request
import json

app = Flask(__name__)

@app.route("/", methods=["POST"])
def index():
    if not request.is_json:
        return {"error": True, "message": "Request is not JSON"}

    data = request.get_json()
    print(json.dumps(data, indent=4))
    return {"error": False}

if __name__ == "__main__":
    app.run(host="0.0.0.0", port=3001, debug=True)
(.venv) bspendlove@home-ubuntu:~/dev/github/grafana-netbox-demo/demo_scripts$ python base_demo_flask.py
 * Serving Flask app "base_demo_flask" (lazy loading)
 * Environment: production
   WARNING: This is a development server. Do not use it in a production deployment.
   Use a production WSGI server instead.
 * Debug mode: on
 * Running on http://0.0.0.0:3001/ (Press CTRL+C to quit)
 * Restarting with stat
 * Debugger is active!
 * Debugger PIN: 259-627-103
Our simple Flask server is now running on port 3001… Let’s create a new device on Netbox and see what happens…
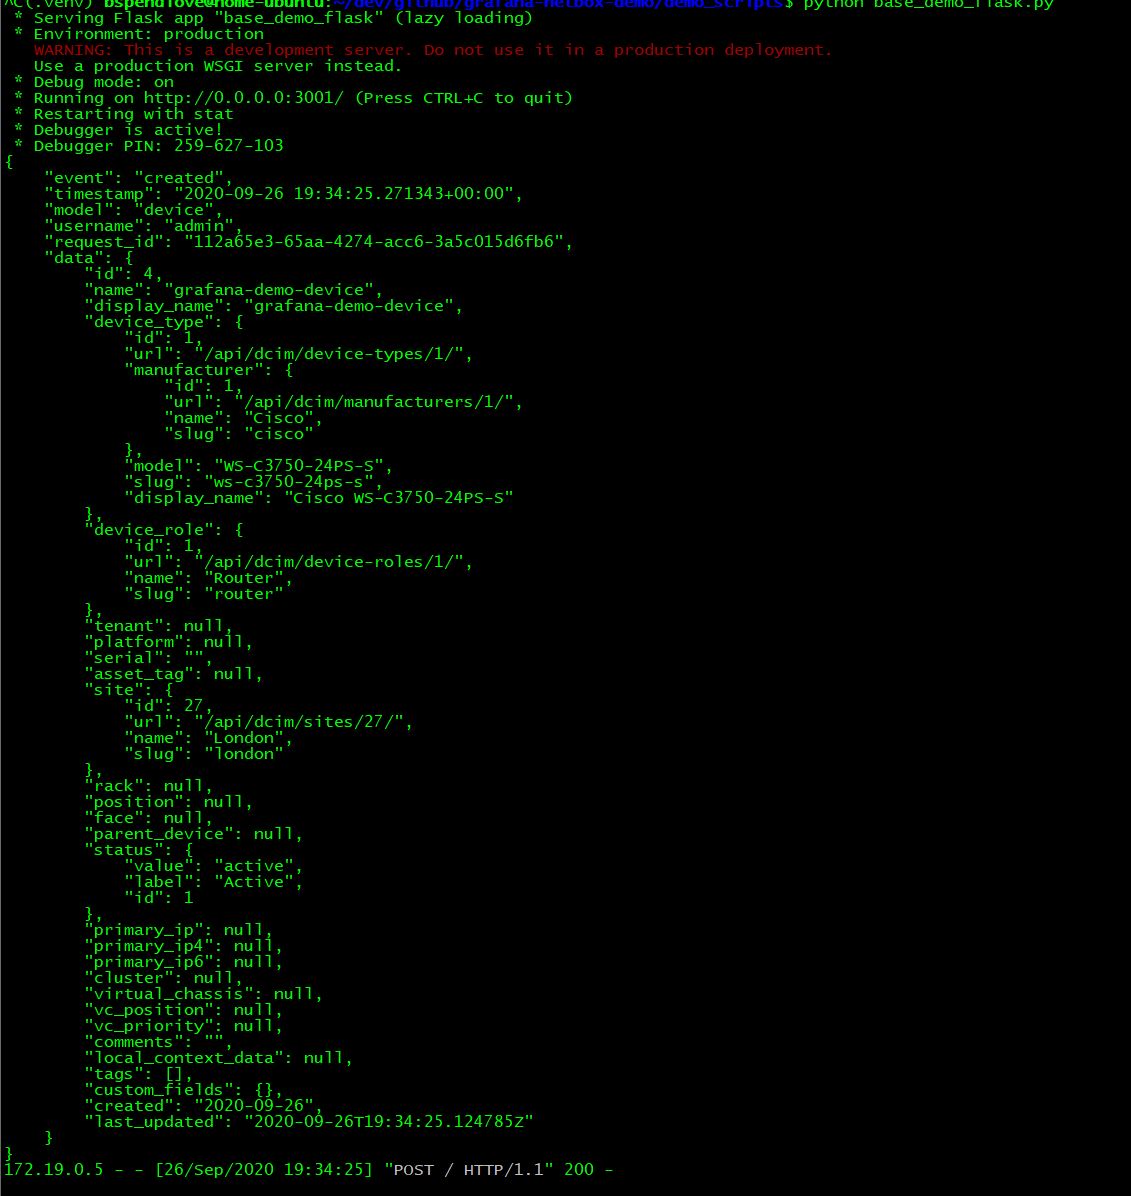
We now have some useful JSON data that can be used. If someone was to update this device then we will probably get a different “event” instead of created. Within the data, we actually receive the ID of the device itself along with some other useful information such as the site (site is a required field when creating a netbox device). My idea now is to ensure before we try to grab any data, we check if the POST request event is “created” or “updated” and the “model” is for device. We can then use the ID to query Netbox using pynetbox and then we will have a python object to play around with instead of using JSON/python dictionaries.
I’ve copied the base python file as a new file incase you want to follow along or just grab the python file yourself instead of typing everything out.
(.venv) bspendlove@home-ubuntu:~/dev/github/grafana-netbox-demo/demo_scripts$ cp base_demo_flask.py base_demo_flask_pynetbox.py
(.venv) bspendlove@home-ubuntu:~/dev/github/grafana-netbox-demo/demo_scripts$ vi base_demo_flask_pynetbox.py
Let’s firstly implement some basic logic to return a dict if the device model or created/updated are not found within the POST data…
data = request.get_json()
if data["model"] != "device":
    return {"error": True, "message": "only device model is supported"}
if data["event"] not in ["created", "updated"]:
    return {"error": True, "message": "only created and updated are supported"}
I’m now going to assign the ID to a variable called ‘device_id’ and then copy+paste our previous pynetbox.api object after setting that variable. Don’t forget to import pynetbox at the top of your python file if you are following along…
import pynetbox # Add  this to the top of your python file like the previous example

device_id = data["data"]["id"]
nb = pynetbox.api(
    'http://192.168.0.16:32768', # Your Netbox Host URL
    token='838e37d04d68a2a3eeb3a08904b27ac1d52004b0' # Your Netbox API Token generated in the Admin view
)
device_object = nb.dcim.devices.get(device_id) # .get allows us to pass in the database ID of the device (or a name if the argument is given but by default it will try to return the device ID as specified. This is now a python object instead of a dictionary...)
print(device_object)
return {"error": False}
Instead of creating a new device, we can run this Flask application again and see if we get any output when we make an UPDATE to the device via Netbox. I’m going to simply add a comment on the device in Netbox. Remember to run the new python script we’ve created (not the base_demo_flask.py)…
(.venv) bspendlove@home-ubuntu:~/dev/github/grafana-netbox-demo/demo_scripts$ python base_demo_flask_pynetbox.py
 * Serving Flask app "base_demo_flask_pynetbox" (lazy loading)
 * Environment: production
   WARNING: This is a development server. Do not use it in a production deployment.
   Use a production WSGI server instead.
 * Debug mode: on
 * Running on http://0.0.0.0:3001/ (Press CTRL+C to quit)
 * Restarting with stat
 * Debugger is active!
 * Debugger PIN: 259-627-103
grafana-demo-device
I’m going to just amend the above python file so we also print all the related interfaces to this specific device. We can do this by querying the dcim.interfaces and specify a filter to only return interfaces belonging to our “grafana-demo-device” which has an ID of 4 in our netbox. If we quickly take a look at the Netbox API explorer that is built into Netbox, we can navigate to /api/dcim/interfaces and get an idea what we need to filter for…
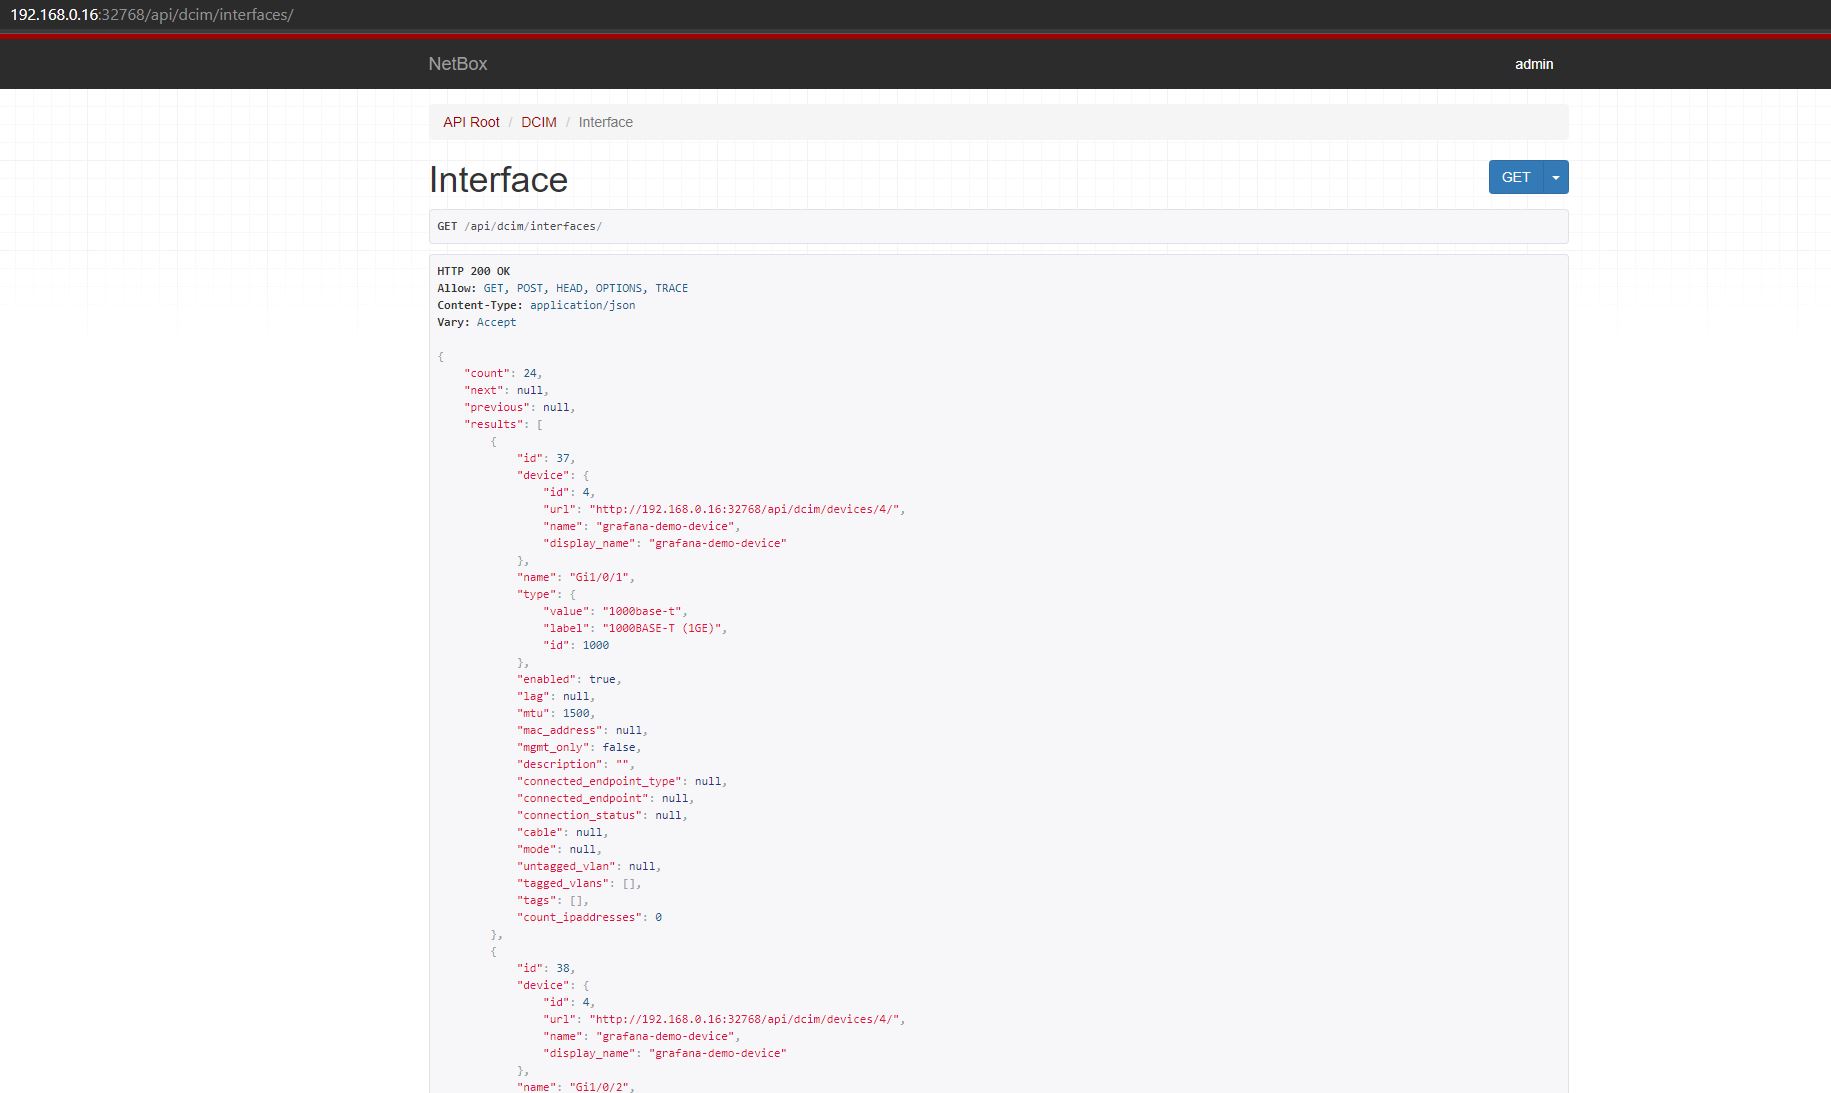
Each interface is given a unique ID to reference in the Netbox database, however we can see that there is a “device” section somewhat like some metadata… We can simply query this by using:
device_object = nb.dcim.devices.get(device_id)
device_interfaces = nb.dcim.interfaces.filter(device=device_object)

# Output: [Gi1/0/1, Gi1/0/2, Gi1/0/3, Gi1/0/4, Gi1/0/5, Gi1/0/6, Gi1/0/7, Gi1/0/8, Gi1/0/9, Gi1/0/10, Gi1/0/11, Gi1/0/12, Gi1/0/13, Gi1/0/14, Gi1/0/15, Gi1/0/16, Gi1/0/17, Gi1/0/18, Gi1/0/19, Gi1/0/20, Gi1/0/21, Gi1/0/22, Gi1/0/23, Gi1/0/24]
With this information, let’s design a quick and dirty Grafana panel to give us the In and Out octets from the IfXTable.
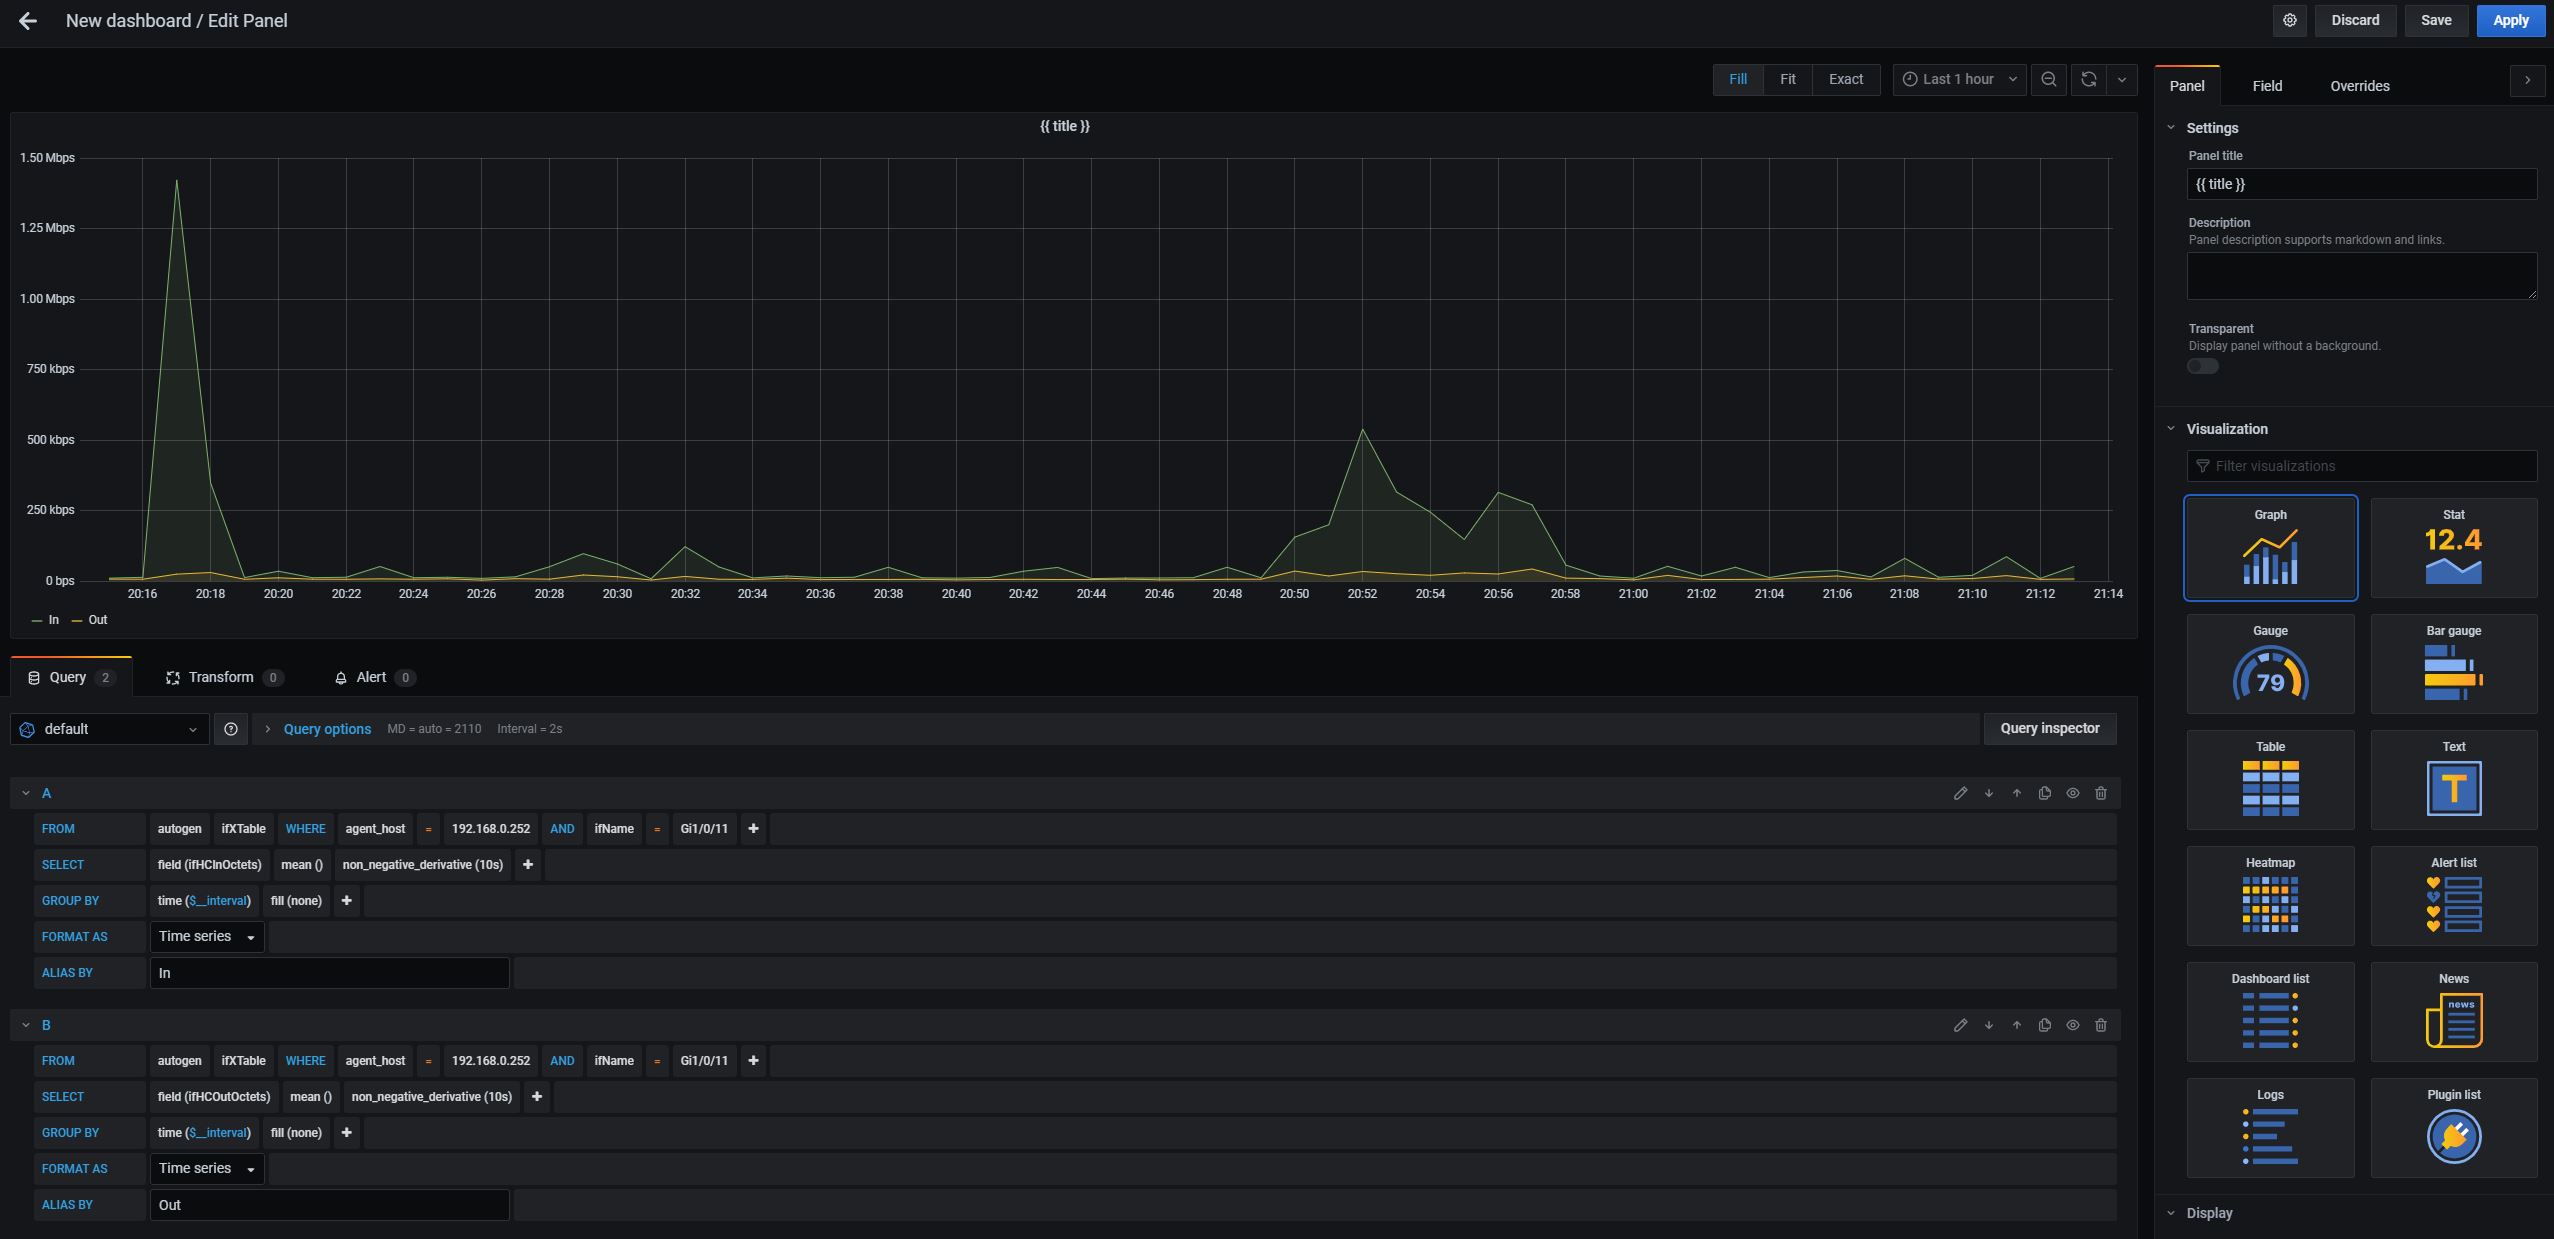
I’ve created a quick and dirty dashboard with the relevant information I need on all my interfaces. Notice for the “Panel Title” I’ve added ‘title’ in curley braces. This is to make it easier to identify in the next step. You can export the JSON format of this template in Grafana which I am going to do and called it “grafana-demo-device-exported.json”. You’ll find this template upload to the Github under the demo_scripts folder.
I’m going to clean up this JSON output because it contains a lot of data that isn’t required. You can clean up this JSON file as much as you want to see which values are actually required to get the same visuals as before but a lot of information such as the datasources, tool tips, colours, gridpos, any null strings/empty lists can be deleted… I’m going to create 2 JSON files, 1 for the base of the dashboard and the other will be the interface panel format.
You can build the JSON data yourself in python using a dictionary but not a lot will change so what I’ve done is created the base template used for the different devices, and then created an interface_panel JSON template with all the relevant fields blanked out with curley braces. I can then simply load the JSON file, perform a .replace() on the string, load it with the python json module and then I can start appending the different interfaces to the base template and finally have a complete template.
import json

base_template = open("dashboard.json").read()
interface_template = open("interface_panel.json").read()

base_template = base_template.replace("", "grafana-demo-device")

interface_templates = []
for interface in ["Gi1/0/1", "Gi1/0/2", "Gi1/0/3", "Gi1/0/4"]:
    _t = interface_template
    replace_values = {"": "192.168.0.252", "": interface, "": interface}
    for k,v in replace_values.items():
        _t = _t.replace(k,v)
    interface_templates.append(json.loads(_t))

base_template = json.loads(base_template)
base_template["panels"] = interface_templates

with open("template_example.json","w") as exampleFile:
    exampleFile.write(json.dumps(base_template, indent=4))
What happens if we try to import this into Grafana?
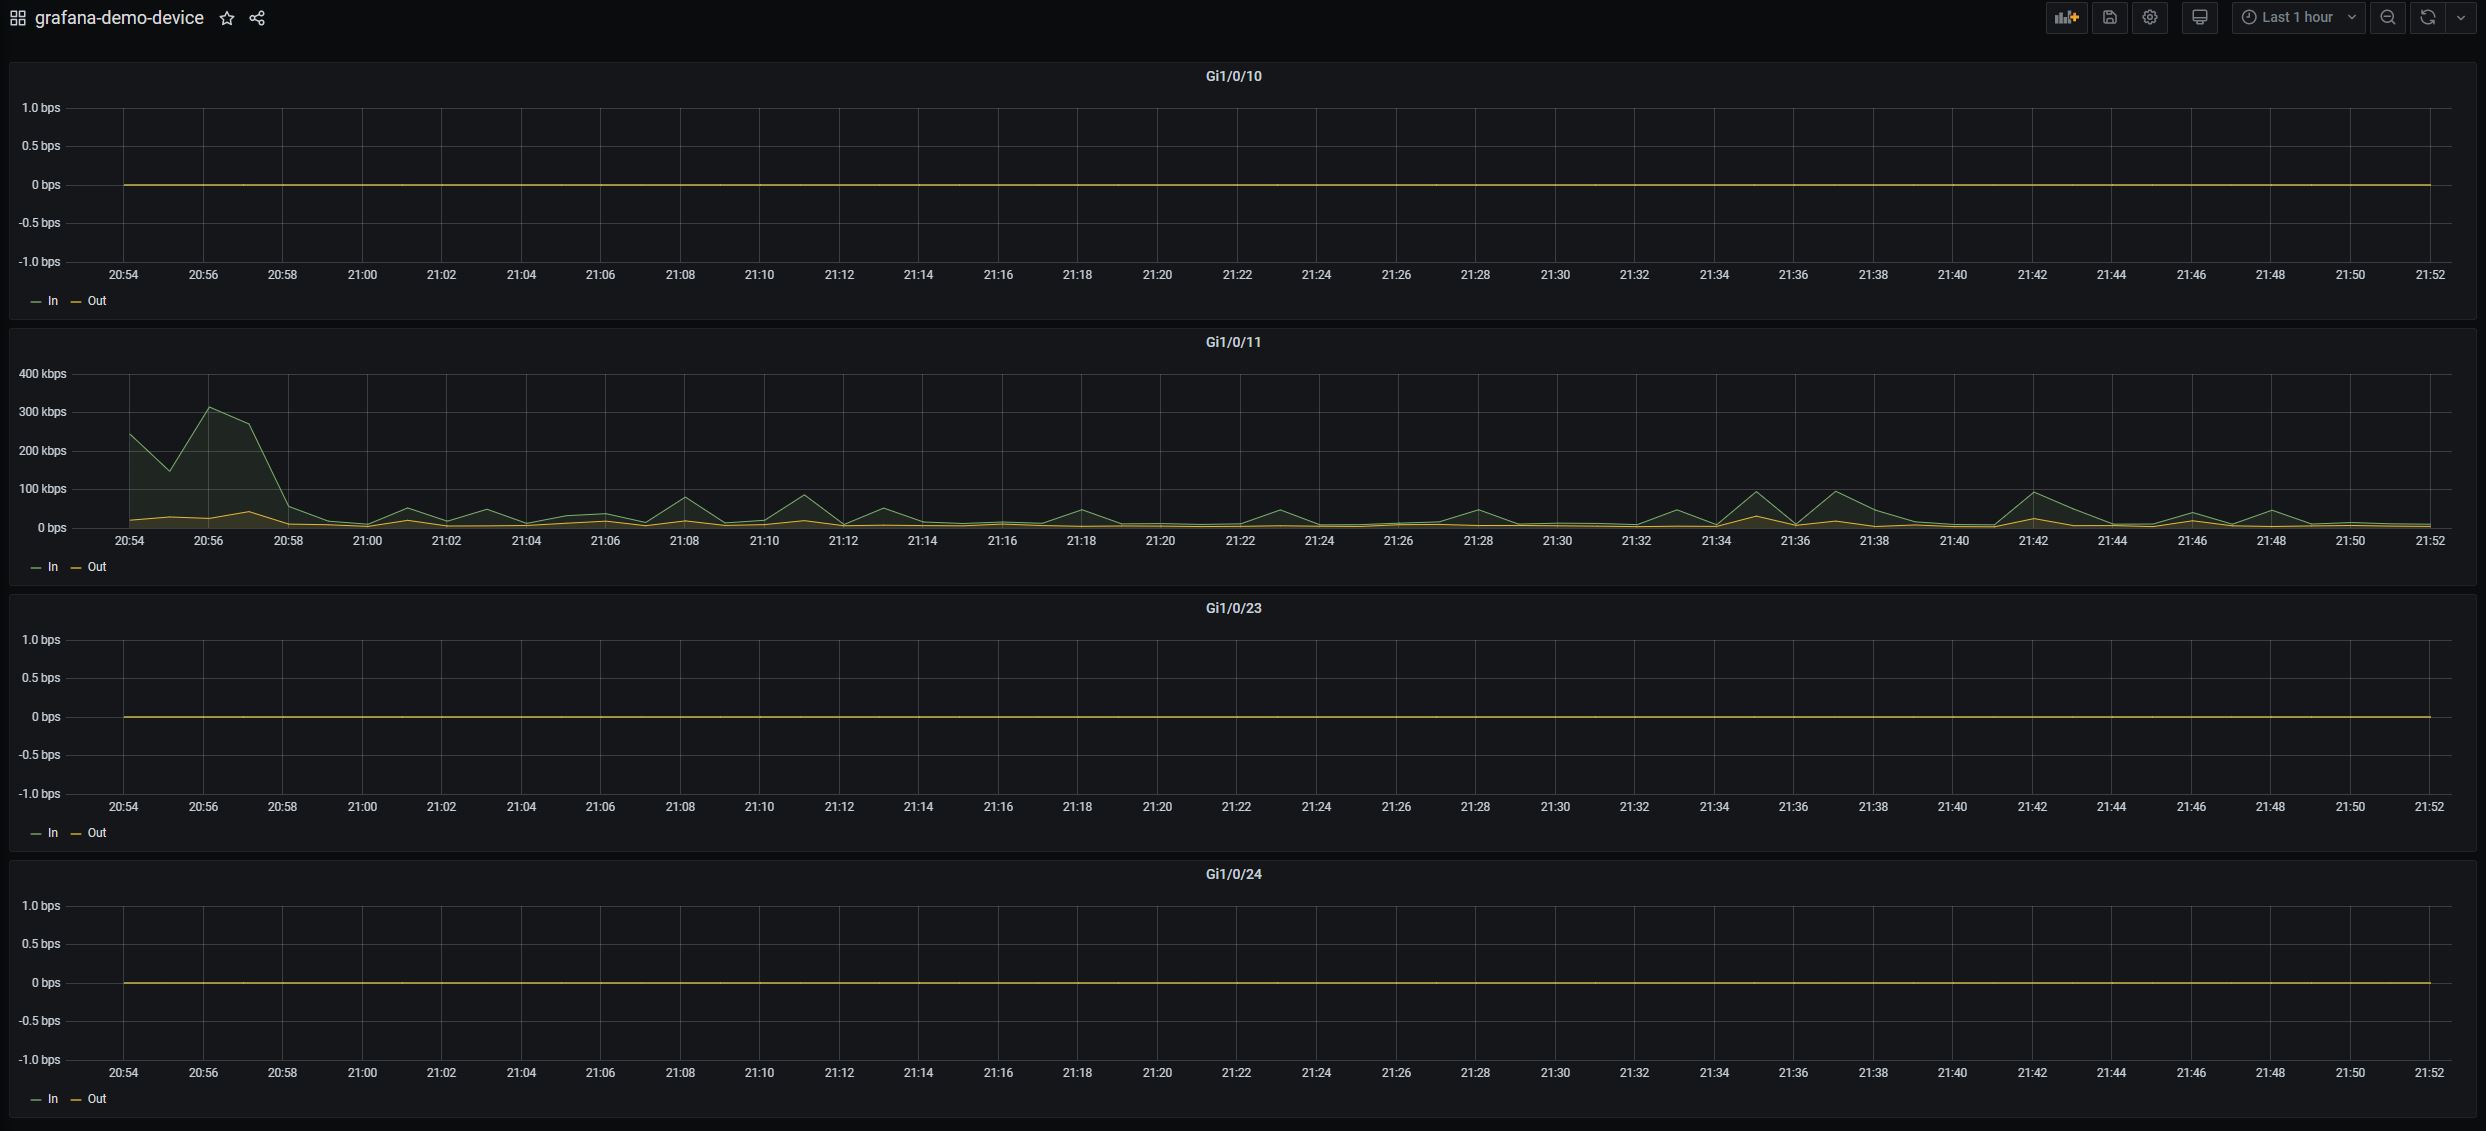
Well… It works! You can see within the templates I have cleaned up (dashboard.json and interface_panel.json), I have removed all empty lists/arrays and any null values and it imported very nicely. Let’s move this along and introduce the same concept to our simple flask API which our Netbox webhooks are currently being sent to. The overall task/final solution is:
- Query netbox device from the ID given to us via the POST data.
- Generate a base template based on the title/name of the device.
- Grab all the interfaces that belong to that specific device in question and generate all the interface templates.
- Amend the interface templates to the base template and introduce the grafana_api python module.
- Grab the “General” folder from Grafana and generate the dashboard with the data we have. Overwrite any dashboards if they already exist because we want to update the Grafana dashboard when someone changes something on Netbox.
You can generate an API key for Grafana by logging in as an administrator and finding the “API Keys” tab under the Configuration icon. Ensure that the correct permissions are selected depending on what you want to do with Grafana (Editor permission is fine for this example).
You’ll find a fully documentation python file instead of me writing out each section on this blog because it would just become a clutter full of code snippets. Essentially we have created a few functions from the previous code demonstrated in this blog to generate the base template + interface templates. We generated these simple templates by exporting the JSON data within the Grafana Dashboard to give us a base to work on. Using the above example to generate the JSON complete template for grafana, we can interact with Grafana using the grafana_api python module.
def add_dashboard_to_grafana(dashboard):
    api = GrafanaFace(
        auth="eyJrIjoiVTRUNlVNY0dHS1F3aU9JZnc1a2hWaFFpQUdVWFVhUWYiLCJuIjoiZ3JhZmFuYS1kZW1vLWRldmljZSIsImlkIjoxfQ==",
        host="192.168.0.16",
        port=3000,
        protocol="http"
    )

    print("Trying to add dashboard to Grafana")
    dashboard = api.dashboard.update_dashboard({"dashboard": dashboard, "overwrite": True})
Dashboards must have a unique name within the same folder otherwise you can specify the “overwrite” key to overwrite any dashboards that may have the same title as the one you’re trying to add via the API. You can find the final product within the github repo under “demo_scripts/final_product” which includes the flask application (app.py) and the 2 JSON templates I’ve worked with that just display basic information for the IN and OUT octets using the IfXTable. I’ve found that copying my own folder of MIBs into the telegraf container works much smoother than depending on the MIBs pre-build into the container.
The docker-compose file is what I’ve been using during this blog and you can find an example of the credentials/urls required which I pass into the containers from the “env” folder. This folder contains environment variables for: infxludb (database) and telegraf (SNMP Collector).
The telegraf folder contains a main configuration file that is required to get the minimum up and running for the InfluxDB Output and a folder containing a lab device I produced the automated dashboards against. (A Cisco 3750G Switch), reachable from the container (192.168.0.252) and finally with the snmp configuration: snmp-server community ciscodisco rw to avoid any misconfigurations like the reader having to configure ACLs or SNMPv3…
Please consider this blog a follow along to the code within the github repo: https://github.com/BSpendlove/grafana-netbox-demo
Please feel free to leave any comments or ask any questions.